Any Survivors of the Initial Blasts will not survive the aftermath, a Nuclear Winter that rivals the last Ice Age and Fallout that will make the long term effects worse that COVID. This is, in a nutshell, the reason that the Alien Visitors are so horrified that we, in our supreme stupidity, would ever let hit happen. There are NO PLACES TO HIDE!!! In all likelihood, those survivors will hunt down and eliminate anyone remotely responsible

by R. P. Turco, O.B. Toon, T.P. Ackerman, O.B. Pollack and Carl Sagan
25 July 1983
from NASATechnicalReportsServer Website
Abstract
We investigate the global atmospheric and climatic consequences of nuclear war for a wide range of detonation yields and scenarios, and for variations of uncertain physical parameters over their plausible ranges of values.
Significant hemispherical (and possibly global) attenuation of the solar radiation flux (to less than ten percent of ambient for several weeks) and cooling of continental land areas (by 30 K or more for 1 to 2 months) may be caused by smoke generated in city and forest fires ignited by airbursts of. all yields, and by fine dust raised in high-yield surface bursts.
A limited number of nuclear explosions around urban centers, amounting to only ~ 100 megatons of total yield, can create smoke optical depths > 1 for weeks and, even in summer, subfreezing land temperatures for months. In most, of the simulated exchanges involving several thousand megatons, in which both dust and smoke are generated, light levels are initially reduced to a few percent of ambient, and temperature minima are < 250 K.
Radioactive fallout on intermediate timescales (days to weeks) can lead to mean doses of ionizing radiation (from external plus internal emitters) of 100 rads or more at Northern mid-latitudes.
Introduction
Concern has been raised over the short – and long-terra consequences of the dusk – smoke, radioactivity and toxic vapors generated by a nuclear “war” (1-7). The discovery that dense clouds of soil particles may have played a major role in past mass extinctions of life on Earth (8-10) has encouraged our reconsideration of nuclear war effects. It has also been suggested that massive fires ignited by nuclear explosions could generate immense quantities of sooty smoke, which attenuates sunlight strongly (7).
These recent developments have led us to calculate, using new data and improved models, the climatic effects of dust and smoke clouds (henceforth, nuclear dust and nuclear smoke) generated in a nuclear war (11).
After a full exchange, thousands of such clouds, produced by individual explosions and merging with one another, could blanket northern mid-latitudes in days, altering the atmospheric radiation balance and eventually perturbing the circulation and climate on a global scale. Possible rapid transfer of tropospheric and stratospheric dust and smoke from the Northern to the Southern Hemisphere, ignored in previous investigations, could involve the entire globe in the aftereffects.
Below, we discuss the long-term impacts of nuclear warfare, but deliberately neglect the short-term effects of blast, fire and radiation, which would surely represent, by themselves, an unprecedented human catastrophe (12-14). However, most of the world’s population could survive the initial nuclear exchange, and would inherit the post-war environment. Accordingly, the global-scale aftereffects of nuclear war might prove to be as important as, or more important than, the conflict itself.
To study these phenomena, we employ a series of physical models: a nuclear scenario model, a particle microphysics model, and a radiative-convective model. The nuclear scenario model calculates the altitude-dependent dust, radioactivity, smoke and N0X injections for each explosion in a nuclear exchange (given the size, number and types of detonations, including heights of burst, geographical locales and fission yield fractions).
The source model parameterization is discussed below, and in a detailed report (15). The one-dimensional microphysical model (15-17) predicts the time evolution of horizontally-dispersed dust and smoke clouds. The radiative-convective model utilizes the predicted dust and smoke particle size distributions and optical constants, and Mie theory to calculate visible and infrared optical properties, light fluxes, and air temperatures as a function of time and height.
The techniques used in these calculations are also well documented (15-18).
Scenarios
We have reviewed the world’s nuclear arsenals (19-23). The primary strategic and theater weapons amount to ~ 12,000 megatons (MT) of yield carried by ~ 17,000 warheads. While the total number of high-yield warheads is declining with time, roughly 7,000 MT may still be accounted for by warheads > 1 MT.
These awesome arsenals munitions which are ignored in this analysis. Scenarios for the possible use of nuclear weapons are complex and controversial. Historically, studies of the long-term effects of nuclear war have focused on a full-scale exchange in the range of 5,000 to 10,000 MT (2, 12, 19). Such exchanges are possible, given the current arsenals, and the unpredictable nature of warfare, particularly nuclear warfare, in which escalating massive exchanges are likely (24).
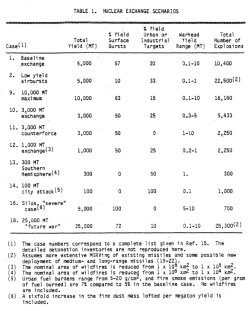
An outline of the scenarios adopted here is presented in Table 1 (below-left image).
The baseline scenario assumes a net exchange of 5,000 MT. Other cases span a range of total yield from 100 to 25,000 MT. Many high-priority military and industrial assets are located near or within urban zones (25). Accordingly, a modest fraction of the total yield is assigned to urban/industrial targets.
Owing to the large yields of strategic warheads (> 100 kilotons, KT), “surgical” strikes against individual targets are difficult; e.g., a 100 KT airburst can level and burn an area of ~ 50 km2, and a 1 MT burst, ten times that area (26, 27).
The properties of nuclear dust and smoke are critical to the present analysis.
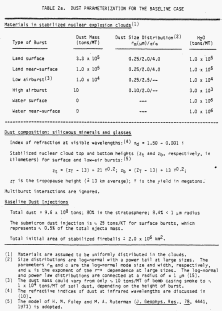
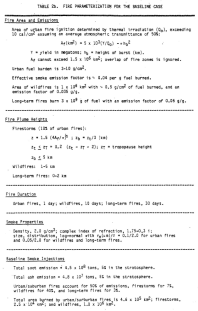
The basic parameterizations are described in Tables 2a and b (above images, center and right), respectively.
For each explosion scenario, the fundamental quantities which must be known to make optical and climate predictions are the total atmospheric injections of fine dust (< 10 um radius) and soot.
Nuclear explosions at or near the ground can generate fine particles by several mechanisms (26):
- ejection and disaggregation of soil particles (28)
- vaporization and re-nucleation of earth and rock (29)
- blow-off and sweep-up of surface dust and smoke (30)
Analyses of nuclear test data indicate that roughly 1-6 x 10² tons of dust per megaton of explosive yield are held in the stabilized clouds of land surface detonations (31). Moreover, size analysis of dust samples collected in nuclear clouds indicates a substantial submicron fraction (32).
The data suggest that nuclear surface detonations may be much more efficient in generating fine dust than volcanic eruptions (15), which have been used inappropriately in the past to calibrate the impacts of nuclear war (2).
The intense light emitted by a nuclear fireball is sufficient to ignite flammable materials over a wide area (26). The explosions over Hiroshima and Nagasaki both initiated massive conflagrations (33). In each city, the region heavily damaged by blast was also consumed by fire (34). Assessments carried out over the past two decades strongly suggest that widespread fires would occur following most nuclear bursts over forests and cities (35-41).
The Northern Hemisphere has = 4 x 10⁷ km2 of forest land, and holds an average = 2.2 g/cm2 of fuel (7).
The world’s urban and suburban zones cover an area = 1.5 x 10⁶ km2, with an average fuel burden = 2-5 g/cm2 (15); central cities, which occupy an area = 50,000 km2, have fuel loads = 10-40 g/cm2 (39, 40, 42, 43). The smoke emissions of wildfires and large-scale urban fires probably lie in the range ~ 2-8% by mass of the fuel burned (44).
The highly-absorbing sooty fraction (principally graphitic carbon) of the smoke could vary from 5-30% by weight (45, 46). In wildfires, and probably in urban fires. > 90% of the smoke mass consists of particles < 1 urn in radius (47). For optical calculations, smoke particles were assigned an imaginary part of the refractive index of 0.3 (48).
A number of calculations were made to test the sensitivity of the results to the choices of the physical parameters. These included the nuclear dust size distribution function, the total dust lofted, smoke emission fractions, fire plume heights, aerosol optical constants, particle agglomeration rates and rainout lifetimes, and cloud dispersal rates.
The most significant findings of the sensitivity analysis are summarized below.
Simulations
The model predictions discussed here generally represent effects averaged over the Northern Hemisphere (N.H.). The initial nuclear explosions and fires would be largely confined to northern mid-latitudes (~ 30°N to 60°N) (49).
Zonal spreading following a massive exchange might occur within a few days, especially since the dust and smoke clouds would initially be widely distributed in longitude (15). Accordingly, the predicted dust and smoke opacity could be larger by a factor of 2 to 3 at mid-latitudes, but smaller elsewhere.
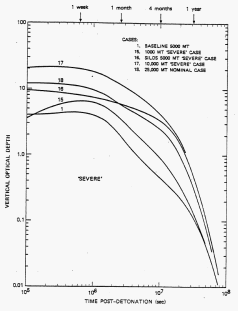
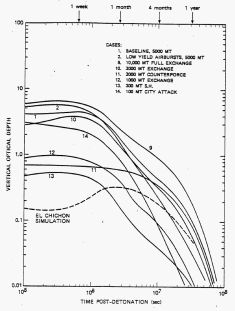
The hemispherically-averaged visible wavelength extinction optical depths (50) of the mixed nuclear dust and smoke clouds corresponding to the scenarios listed in Table 1 are shown in Figure 1 far below. For the purpose of discussion, the vertical optical .depth provides a convenient diagnostic of cloud properties, which may be used roughly to scale atmospheric light levels and temperatures, for the various scenarios.
In the baseline scenario (Case 1, 5,000 MT), the initial optical depth is ~ 4, of which ~ 1 is due to stratospheric dust and ~ 3 to tropospheric smoke. After 1 month the optical depth is still ~ 2. Beyond 2-3 months, dust dominates the optical effects, as the soot is largely depleted by rainout and washout (52). In the baseline model, about one-third of the world’s urbanized land area, or ~ 480,000 km2, is partially burned by ~ 1,000 MT of explosions (which represents just 20% of the net exchange yield).
The mean quantity of fuel consumed over this area is ~ 1.9 g/cm2, compared to ~ 2-5 g/cm2 in residential areas and s 10-40 g/cm2 in city centers (15, 42). Wildfires ignited by the remaining 4,000 MT of yield are assumed to burn another 1 x 10⁶ km2 of forest, brush, and grasslands (7, 37), consuming s 0.5 g/cm2 of fuel in the process (7). The total smoke emission in the baseline model is 450 million tons (released over several days); by comparison, current global smoke emissions (released over one year) are estimated as ~ 200 million tons (15).
The optical depth simulations for Cases 1, 2, 9 and 10 in Figure 1 far below, show that a range of exchanges between 3,000 and 10,000 MT might cause nearly the same effects. Even Cases 11, 12 and 13, while less severe in their absolute impact, produce optical depths comparable to or exceeding those of a major volcanic eruption.
It is noteworthy that eruptions such as Tambora in 1815 may have produced historically significant climate perturbations (53-55).
Unexpectedly, Case 14, a limited 100 MT airburst attack over cities, generates large smoke opacities over at least a hemisphere. In this scenario, the cores of ~ 200 cities are partially burned. Most large cities hold important strategic targets, which suggests that, in any nuclear exchange, a substantial number of explosions would occur in urban settings where combustible materials are concentrated. Strategic warheads targeted on cities lie in the > 100 KT range, and are capable of igniting fires over large areas adjacent to targets.
These facts imply a relatively low threshold for major optical and climatic consequences in a nuclear war.
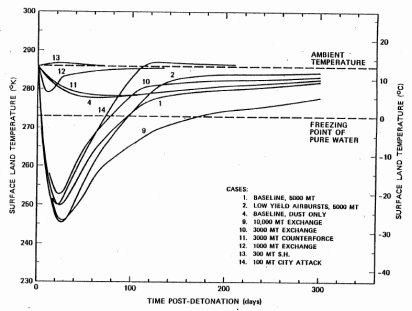
Figure 2 gives the surface temperature perturbation over land calculated from the dust and smoke optical depths for several exchange scenarios. Most striking are the extremely low temperatures occurring within 3-4 weeks after a major exchange. In the baseline 5,000 MT model, a minimum temperature of ~ 250 K (-23°C) is predicted after 3 weeks. Subfreezing temperatures persist for several months. Among the cases shown, even the smallest temperature decreases are ~ 5-10°C (Cases 4, 11 and 12).
Since average surface temperature changes of only 1°C are considered significant (56), severe climatological consequences might be expected in each of these cases. Even the 100 MT city airburst scenario (Case 14) produces a two-month interval of subfreezing land temperatures, with a minimum again near 250 K. The temperature recovery in this instance is hastened by the absorption of sunlight in optically thin late soot clouds (see below).
Comparable exchanges with and without smoke emission (e.g., Cases 10 and 11) show that the tropospheric soot layers cause a sudden surface cooling of short duration, while fine stratospheric dust is responsible for prolonged cooling lasting a year or more.
In all cases considered, nuclear dust acts to cool the Earth’s surface. Soot also tends to cool the surface except when the soot cloud is both optically thin and located near the surface [an unimportant case because only relatively small transient warmings < 2K can thereby be achieved (57)].
The predicted temperature variations of the world’s oceans due to radiative transport alone are always small (~ 3 K cooling), owing to the great heat capacity and rapid mixing of surface waters. However, changes in the atmospheric zonal circulation patterns (see below), might significantly alter ocean currents and upwelling, as has occurred on a smaller scale recently in the Eastern Pacific (“El Niño”).
The oceanic heat reservoir would also moderate the predicted continental land temperature decreases, particularly in coastal regions (10). The effect on interior continental temperatures is difficult to assess due to possible changes in atmospheric circulation patterns.
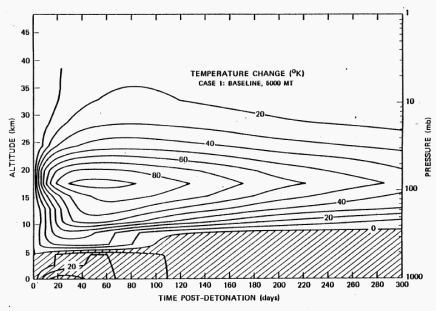
The predicted temperature changes (from ambient values) for the baseline nuclear exchange are illustrated as a function of time and altitude in Figure 3. The dominant features of the temperature perturbation are a large warming (up to 80 K) occurring in the lower stratosphere and upper troposphere and a large cooling (up to 40 K) of the surface and lower troposphere. The warming is caused by the absorption of solar radiation in the upper-level dust and smoke clouds, and persists for an extended period due to the long residence time of the particles at great elevations.
The strength of the warming is due both to the low thermal inertia of the atmosphere (because of its low density) and the initially cold temperatures at high altitudes. The low-level cooling is the result of the attenuation of the incident solar radiation by the aerosol clouds (see Figure 4) during the early period of the simulation. No greenhouse effect occurs, because the solar energy is deposited above the height at which infrared energy is radiated to space.
The present results do not reflect the strong coupling between the modified heating/cooling rates computed here and the bulk atmospheric motions. Global circulation patterns would probably be altered in response to such large disturbances in the driving forces.
However, the prediction of circulation anomalies is beyond the capability of our 1-d radiative-convective model.
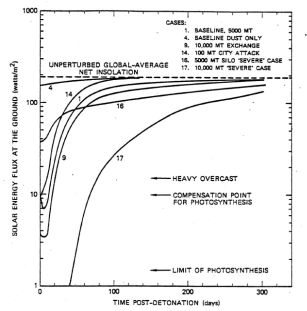
Decreases in insolation for several nuclear war scenarios are given in Figure 4. The baseline case implies average solar fluxes at the ground < 10% of normal values for several weeks. In addition to causing the temperature declines discussed above, the attenuated insolation could affect plant growth rates, and vigor in the marine (58), littoral and terrestrial food chains.
In the 10,000 MT “severe” case, average light levels are below the minimum required for photosynthesis for about 40 days over much of the N.H. In a number of other cases, insolation may, for more than two months, fall below the compensation point,, at which photosynthesis is insufficient to maintain plant metabolism.
Because the nuclear clouds are likely to remain patchy the first few weeks after an exchange, the leakage of sunlight through holes in the clouds could enhance the levels of plant growth activity above those predicted for average cloud conditions.
Sensitivity Tests
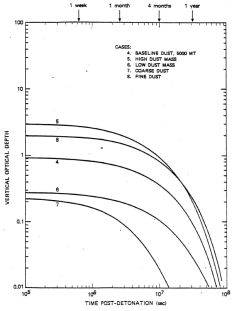
Figure 5 shows the effects of variations in the nuclear dust parameters on the baseline dust cloud opacity (with soot excluded). The initial dust optical depths vary from ~ 0.2 to ~ 3.
Nuclear dust alone could produce a significant climatological excursion, particularly if the submicron component is as much as 20-50 tons/KT. However, if the submicron particles comprise < 10 tons/KT, the dust optical effects would be no worse than for a major volcanic eruption. In the baseline case, the dust opacity is much greater than the opacity associated with the El Chichon and Agung eruptions (18, 59).
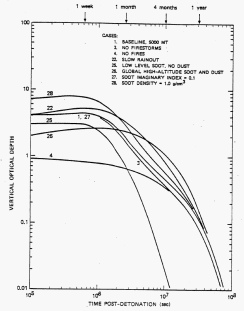
Figure 5 compares cloud optical depths for several variations of the baseline model smoke parameters (with dust included). In the baseline case, it is assumed that firestorms inject only a small fraction (~ 5%) of the total smoke emission into the stratosphere (60). Thus, Case 1 and Case 3 (no firestorms) are very similar. However, if all the smoke is injected into the stratosphere and rapidly dispersed around the globe, Case 26 shows that large optical depths might endure for a year (Figure 6).
A prolongation of optical effects is also obtained in Case 22, where the tropospheric washout lifetime of smoke particles is increased from 10 to 30 days near the ground. By contrast, when the nuclear smoke is initially contained near the ground, and the dynamical and hydrological processes are assumed to be unperturbed, smoke removal is much faster (Case 25). Some of the smoke still diffuses to the upper troposphere and remains there for several months (61).
If the smoke is composed mainly of oily compounds, the particle density may be closer to 1 g/cm2 than to the baseline value of 2 g/cm2 (Ref. 48). Case 28 in Figure 6 (far below) shows that the smoke opacity is roughly doubled when the lower density is used (i.e., for a fixed smoke mass emission and size distribution, the particle number density and optical depth vary inversely with the bulk density).
On the other hand, the optical depths calculated for smoke imaginary refractive indices between 0.1 and 0.3 show virtually no differences (Cases 1 and 27). In other calculations, the imaginary refractive index was allowed to vary between 0.3 and 0.01. At a value of 0.05, the absorption optical depth (50) was reduced by only ~ 50%, and at a value of 0.01, by ~ 85%.
The overall extinction, moreover, increased by ~ 5%. These results demonstrate that light absorption and heating rates in the nuclear smoke clouds are not very sensitive to graphitic carbon fractions larger than a few percent.
One sensitivity test (Case 29, not illustrated) considers the optical effects in the Southern Hemisphere (S.H.) of soot and dust transported from the N.H. stratosphere. In this calculation, the smoke in the 300 MT S.H. Case 13 is combined with half the baseline stratospheric dust and smoke (to approximate rapid global dispersion in the stratosphere).
The initial optical depth is ~ 1 over the S.H., dropping to about 0.3 in 3 months. The predicted average S.H. continental surface temperatures fall by 8 K within several weeks and remain at least 4 K below normal for nearly 8 months. The seasonal influence should be taken into account, however.
For example, the worst consequences for the N.H. might result from a spring or summer exchange, when crops are vulnerable and fire hazards are greatest. The S.H., in its fall or winter, might then be least sensitive to cooling and darkening. Nevertheless, the implications of this scenario for the tropical regions in both hemispheres would appear to be serious, and worthy of further analysis. Seasonal factors can also modulate the atmospheric response to perturbations by smoke and dust, and should be considered.
A number of sensitivity tests for more “severe” cases were run with scenario yields ranging from 1,000 to 10,000 MT and smoke and dust parameters assigned larger, but not implausible, values. The predicted effects are clearly substantially worse. The lower probabilities of these assigned parameter values must be weighed against the catastrophic outcomes which they imply.
Prudent policy would calibrate the importance of these scenarios as the product of their probabilities and the costs of their corresponding effects. Unfortunately, we are unable to give an accurate quantitative estimate of the relevant probabilities. By their very nature, however, the severe cases may be the most important to consider in the deployment and use of nuclear weapons.
With these reservations in mind, we present the optical depths for some of the more “severe” cases in Figure 7. Large opacities can persist for a year, and land surface temperatures can fall to 230-240 K, or about 50 K below normal. Combined with low light levels (Figure 4 – far below), these scenarios raise the possibility of catastrophic widespread ecological consequences.
Two sensitivity tests were run to determine roughly the implications for optical properties of aerosol agglomeration in the early expanding clouds (the simulations already take into account the continuous coagulation of the particles in the dispersed clouds).
Very slow dispersion of the initial stabilized dust and smoke clouds over the N.H., taking nearly 8 months, was assumed. Coagulation of particles reduced the average opacity after 3 months by about 40%. When the adhesion efficiency of the colliding particles was also maximized, the average opacity after 3 months was reduced by ~ 75%.
In the most likely situation, however, prompt agglomeration and coagulation might reduce the average hemispherical cloud optical depths by 20-50%.
Other Effects
We have also considered, in a less rigorous manner, the long-term effects of radioactive fallout, fireba11-generated NOX, and pyrogenic toxic gases (15). The physics of radioactive fallout is well known (2,5,12,26,62).
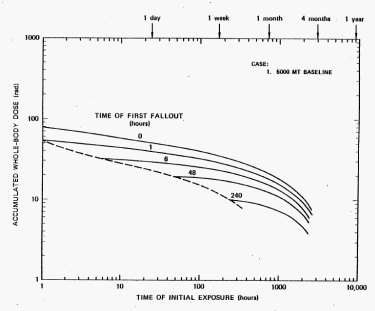
The present calculations bear primarily on the widespread accumulation of intermediate-timescale fallout due to dry deposition and washout of dispersed nuclear dust (63). Predicted average chronic whole-body gamma ray doses for the baseline scenario (5000 MT) are illustrated in Figure 8.
For exposure only to the radioactive dust which begins to fall out after a few days, the hemisphere-average total dose accumulated over several months would be 20 rad. Fallout during this time would be confined largely to northern mid-latitudes; hence the dose there could be ~ 2-3 times as large (64). Considering the accompanying ingestion of biologically active radionuclides (26, 65) and occasional exposure to localized fallout, we estimate an average chronic mid-latitude dose of ionizing radiation for the baseline case > 100 rad (66).
In a 10,000 MT exchange, this mean dose would be doubled.
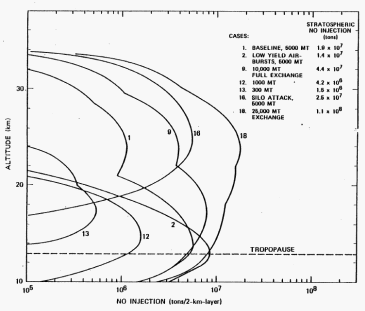
The stratospheric nuclear-NOX/ozone problem has been treated in a number of studies (2-4, 7, 67). The present calculations, using updated chemical rate coefficients, give roughly the same results as these earlier investigations (15). Accordingly, detailed results are not reviewed here. In Figure 9 (far below), however, nuclear-NOx injection profiles are shown for several war scenarios.
Owing to the rather direct dependence of ozone depletion on stratospheric NOx injection, a high sensitivity of the ozone perturbation to the scenario may be inferred. In the baseline case, a maximum hemispherically-averaged ozone reduction of ~ 30% is found. However, this would be. substantially smaller is most yields of individual warheads were < 1 MT.
Considering the relationship between solar UV-B radiation increases and ozone decreases (68), UV-B doses roughly twice normal are expected in the first year following a baseline exchange (after the dust and soot had dissipated). Larger UV-B effects could accompany exchanges involving warheads of larger yields (or large multi-burst lay-downs).
A variety of toxic gases would be generated in large quantities by nuclear fires, including CO and HCN.
According to Crutzen and Birks (7), heavy air pollution, including elevated ozone concentrations, could blanket the N.H. for several months. We are also concerned about dioxins and furans, extremely persistent and toxic compounds released during the combustion of widely-used synthetic organic chemicals (69). Hundreds of tons of dioxins and furans could be generated during a nuclear exchange (70).
The long-term ecological consequences of these compounds also seems worthy of future consideration.
Meteorological Perturbations
Thick clouds of nuclear dust and smoke can cause significant climatic perturbations, and related effects, through a variety of mechanisms:
- reflection of solar radiation to space leading to an overall surface cooling
- modification of solar absorption and heating patterns which drive the atmospheric circulation-on small scales (71) and large scales (72)
- introduction of numerous cloud condensation nuclei which affect the formation of clouds and precipitation (73)
- alteration of the surface albedo by fires and soot (74)
These effects are closely coupled in determining the overall response of the atmosphere to nuclear war (75).
It seems very difficult at present to forecast in any detail the changes in coupled atmospheric circulation and radiation fields, and in weather and microclimates, for the massive dust and smoke injections treated here. Hence, speculation must be limited to the most general considerations.
Water evaporation from the oceans implies a continuing source of moisture for the marine boundary layer. A heavy semi-permanent fog or haze layer might blanket large bodies of water. The consequences for marine precipitation are unclear, particularly if the normal prevailing winds are greatly modified by the perturbed solar driving force.
Cold air from the continents might circulate as offshore winds in coastal regions, causing heavy precipitation in these areas, and inducing a return flow aloft, possibly containing substantial amounts of condensed water. Certain continental zones might be subject to continuous snowfall for several months (10). Precipitation can lead to soot removal, although this process may not be very efficient for nuclear clouds (71, 73).
It is likely that, on average, precipitation rates would be generally smaller than in the ambient atmosphere; the major remaining energy source available for storm genesis is the latent heat from ocean evaporation.
Despite possible heavy snowfalls, it is improbable that an Ice Age would be triggered by a nuclear war. The period of cooling (~ 1 year) is in all likelihood too short to overcome the considerable inertia in the Earth’s climate system. The oceanic heat reservoir would probably force the climate toward contemporary norms in the years following a war.
The CO2 input from nuclear fires is not significant climatologically (7).
Inter-hemispheric Transport
Earlier studies assumed that significant inter-hemispheric transfer of nuclear debris and radioactivity requires a year or more (2).
This perception was based on observations of transport under ambient conditions, including the dispersion of debris clouds from atmospheric nuclear weapons tests. However, with dense clouds of dust and smoke, as described above, massive dynamical disturbances would be expected in the aftermath of a nuclear war.
A rough analogy can be drawn with the evolution of global-scale dust storms on Mars. The lower Martian atmosphere is similar in density to the Earth’s stratosphere, and the period of rotation is almost identical to the Earth’s. Dust storms that develop in one hemisphere on Mars often rapidly intensify and spread over the entire planet, crossing the equator in a mean time 5 10 days (15, 76, 77).
The explanation apparently lies in the heating of the dust aloft, which then dominates other heat sources and drives the circulation. Haberle et al. (76) simulated the evolution of Martian dust storms and found that dust at low latitudes, in the core of the Hadley circulation, is the most critical in modifying the winds. In a nuclear exchange, most of the dust and smoke would be injected at-middle latitudes.
However, Haberle et al. (76) did not include planetary-scale waves in their calculations. Perturbations of planetary wave amplitudes may be critical in the transport of nuclear war debris between middle and low latitudes.
There appear to be four distinct mechanisms which could produce significant atmospheric effects in the S.H.:
- Direct soot injection following targeting of S.H. cities by as few as 100 MT (e.g., Case 14, Figures 1, 2 and 4 – far below).
- Normal tropospheric wind patterns. Because the “meteorological equator” lies near 5°N latitude, some of the debris from nuclear explosions below 20-30°N (e.g., in India and South China) could be carried into the S.H., particularly in the monsoon season (78).
- Normal inter-hemispheric exchange of stratospheric air. For example, photometric observations of the ET Chichon volcanic cloud (origin, 14°N) by the Solar Mesospheric Explorer satellite show that perhaps 10-20% of the aerosol material had been transported to the S.H. after ~ 7 weeks (79).
- Unprecedented tropospheric and stratospheric transport driven by temperature gradients between the hot, dust – and soot-laden N.H. upper atmosphere and the cold, initially-clear, S.H. upper atmosphere.
Resolution of the problem of accelerated inter-hemispheric transport following a large nuclear exchange must await, at the least, more detailed general circulation model calculations.
The response of the atmosphere could turn out to be sensitive to the quantities, altitudes, and geographical locations of the dust and smoke injections, which are uncertain. The implications of rapid inter-hemispheric transport are serious.
If global-scale mixing can occur within a few weeks, the S.H. could be subjected to severe environmental stresses even in the absence of a direct attack.
Conclusions
The studies outlined here suggest severe long-term climatic effects from a paroxysmal 5000 MT nuclear exchange.
Despite uncertainties in the amounts and properties of the dust and smoke produced by nuclear detonations, the following tentative conclusions may be drawn:
- Contrary to the findings of earlier studies [e.g., (2)], global nuclear war might have a major impact on climate — manifested by an unbroken overcast for many weeks, subfreezing land temperatures persisting for several months, large perturbations in global circulation patterns, and dramatic changes in local weather and precipitation rates — a harsh “nuclear winter” in any season. Greatly accelerated inter-hemispheric transport in the stratosphere might also occur, although modeling studies are needed to quantify the importance of this effect; Rapid inter-hemispheric mixing implies that the Southern Hemisphere could be subjected to massive injections of nuclear debris soon after an exchange in the Northern Hemisphere. In apparently all previous studies, S.H. effects have been assumed to be minor. Although the climate disturbances are expected to last for several years, it seems unlikely (although still uncertain) that a major long-term climatic change, such as an Ice Age, would be triggered.
- Relatively large climatic effects might result even from small nuclear exchanges (~ 100 to 1000 MT), because fires can be initiated by nuclear weapons of any size, and as little as ~ 100 MT is sufficient to devastate most of the world’s major urban centers. The existence of such a low threshold yield for massive smoke emissions implies that even limited nuclear exchanges could trigger severe aftereffects. It is much less likely that a 5,000-10,000 MT exchange would produce only relative minor effects.
- The climatic impact of sooty smoke from nuclear fires’ ignited by airbursts is probably more important than dust raised by surface bursts (when both effects occur). Smoke is generally highly-absorbing, whereas soil dust is typically non-absorbing. Smoke particles are extremely small, which lengthens their atmospheric residence times. There is also a high probability that nuclear explosions over cities and forests will initiate widespread fires.
- Smoke from urban fires may be more important than smoke from collateral forest fires for two reasons:
- in a full-scale exchange, cities holding large stores of combustible materials would be attacked directly
- intense firestorms could pump smoke into the upper atmosphere, where the residence time is a year or more.
- Nuclear dust can also contribute to the climatic impact of a nuclear exchange. Previous analogies with volcanic eruptions have been misinterpreted. The dust-climate effect is very sensitive to the conduct of the war; a smaller effect is expected when lower yield weapons are deployed and air bursts dominate over surface land bursts. Multiburst phenomena might synergistically enhance nuclear dust climatic effects, but insufficient data are available to assess this problem.
- Exposure to radioactive fallout may be more intense and widespread than is predicted by standard empirical exposure models, . which neglect the intermediate fallout extending over many days and weeks, particularly when unprecedented quantities of fission debris
are released abruptly in the atmosphere. Average mid-latitude whole-body gamma ray doses of 50-100 rad are possible in a 5000 MT exchange, with much larger doses within the fallout plumes of radioactive debris extending hundreds of kilometers downwind of targets.
- Synergisms between long-term nuclear war stresses – e.g., low light levels, subfreezing temperatures, exposure to intermediate timescale radioactive fallout, heavy air pollution, and UV-B flux enhancements – aggravated by the destruction of medical facilities, food stores, and civil services, could lead to many additional fatalities, and could place the global ecosystem in serious jeopardy.
Our estimates of nuclear war effects are uncertain because the problem is too complex to resolve precisely with existing analytical tools, because the data base is incomplete, and because the problem is not amenable to experimental investigation.
In particular, we are unable to forecast the detailed nature of the changes in atmospheric dynamics and meteorology implied by our nuclear war scenarios, nor the effect of such changes on the maintenance or dispersal of the initiating smoke and dust clouds.
Nevertheless, the magnitudes of the first-order effects are so large, and the implications so serious, that we hope the scientific issues raised here will be vigorously and critically examined (79).
FIGURE CAPTIONS
- Time-dependent hemispherically-averaged vertical optical depths (extinction = scattering plus absorption) of nuclear smoke and dust clouds at 550 nm wavelength. Optical depths < -0.1 are negligible, ~ 1 are significant, and ~ 10 imply possible major consequences. The transmission of sunlight becomes highly nonlinear at optical depths > 1. Results are given for several of the scenarios listed in Table 1 (image far above.) Calculated optical depths for the expanding El Chichon eruption cloud are offered for comparison (51).
- Hemispherically-averaged surface temperature variations following a nuclear exchange. Results are shown for several of the scenarios in Table 1. (Note the linear timescale, unlike that in Figure 1). The temperatures generally apply to the interior of continental land masses. In Cases 4 and 11, fires are neglected. In the other cases, smoke contributes to the temperature effect in varying degrees.
- Northern Hemisphere troposphere and stratosphere temperature perturbations in K° (or in C°) following the baseline nuclear exchange (Case 1). The cross-hatched area indicates cooling. Pressures are given in millibars.
- Solar energy fluxes at the ground over the Northern Hemisphere in the aftermath of a nuclear exchange. Results are given for several of the scenarios in Table 1. (Note the linear timescale.) The solar fluxes are averaged over the diurnal cycle and over the hemisphere. Cases 4 and 16 neglect fires. Also indicated on the figure are the approximate flux levels at which photosynthesis cannot keep pace with plant respiration (compensation point), and at which photosynthesis ceases. These limits vary for different species.
- Time-dependent vertical optical depths (absorption plus scattering at 550 nm) of nuclear dust clouds, in a sensitivity analysis. The optical depths are average values for the Northern Hemisphere. The cases shown are:
- 4, baseline dust only, 3.3 x 10⁵ tons/MT for surface bursts, size distribution as described in (32)
- 5, high dust loading, 1 x 10⁶ tons/MT
- 6, low dust loading, 1 x 10⁵ tons/MT
- 7, coarse dust, mode radius ~ 1.0µm
- 8, fine dust, mode radius ~ 1.0µm
- Time-dependent vertical optical depths (absorption plus scattering at 550 nm) of nuclear smoke clouds, in a sensitivity analysis. The optical depths are average values for the Northern Hemisphere. All cases shown correspond to parameter variations of the baseline model and all include dust appropriate to that case (Case 1):
In Case 4, only dust from the baseline case is considered (fires are ignored) for comparison.
- 3, no firestorms
- 4 no fires
- 22, smoke rainout rate decreased by a factor of 3
- 25, smoke initially confined to the lowest 3 km of the atmosphere
- 26, smoke initially distributed between 13 and 19 km over the entire globe
- 27, smoke imaginary part of refractive index reduced from 0.3 to 0.1
- 28, smoke material density reduced from 2 g/cm3 to 1 g/cm3
- Time-dependent vertical optical depths (absorption plus scattering at 550 nm) for more severe cases of explosion yield for nuclear dust and smoke production. The conditions are detailed in (15), The yield inventories are identical to the nominal cases of the same total yield described in Table 1 (Cases 16 and 18 are listed there). The “severe” cases generally include a sixfold increase in the fine dust injection, and a doubling of the smoke emission. In Cases 15, 17 and 18, smoke causes most of the opacity during the first 1-2 months. In Cases 17 and 18, dust makes a major contribution to the optical effects beyond 1-2 months. In Case 16, fires are neglected and dust from surface bursts produces all of the opacity.
- Hemispherically-averaged nuclear radiation doses associated with fallout in the baseline model (Case 1). The curves correspond to the whole-body gamma ray doses received after a specific initial time (abscissa) in a region where fallout began at a specific earlier time (individual curves). The dashed line defines the maximum dose possible as a function of the initial fallout time. For each curve, the exposure to fallout on the ground is assumed to continue indefinitely.
- Nuclear NOX injections for several exchange scenarios. The injections are given as tons of NO per 2-km altitude interval. As a very rough conversion, each 1 x 10⁶ tons of stratospheric NO injection increases UV-8 radiation exposures at the ground by 2-4% (68). Thus, the baseline case corresponds to a 40 to 80% increment in UV-B fluxes, and Case 18 corresponds to an increment by factors of 2 to 4.
References and Notes
1. Hampson, J., Nature. 250, 189 (1974).
2. National Academy of Sciences, Long-term Worldwide Effects of Multiple Nuclear-Weapon Detonations. 213 pp., Washington, D.C., 1975.
3. Whitten, R. C, W. J. Borucki and R. P. Turco, Nature, 257, 38 (1975).
4. MacCracken, M. C, and J. S. Chang (Eds.), Report UCRL-51653, Lawrence Livermore Laboratory, Livermore, CA, 77 pp., April (1975).
5. Mark, J. C, Ann. Rev. Nucl. Sci., 26, 51 (1976).
6. Lewis, K. N., Sci. Amer., 241, 35 (1979).
7. Crutzen, P. J., and J. W. Birks, Ambio, 11, 114 (1982).
8. Alvarez, L. W., W. Alvarez, F. Asaro and H. V. Michel, Science, 208, 1095 (1980); Alvarez, W., F. Asaro, H. V. Michel and L. W. Alvarez, Science, 216, 886 (1982); Alvarez, W., L. W. Alvarez, F. Asaro and H. V. Michel, Geological Soc. Amer. Special Paper 190, L. T. Silver and P. H. Schultz, Eds., p. 305 (1982).
9. Ganapathy, R., Science, 216, 885 (1982).
10. Toon, 0. B., J. B. Pollack, T. P. Ackerman, R. P. Turco, C. P. McKay and M. S. Liu, Geological Soc. Amer. Special Paper 190, L. T. Silver and P. H. Schultz, Eds., p. 187 (1982); Pollack,. J. B., 0. B. Toon, T. P. Ackerman, C. P. McKay and R. P. Turco, Science, 219, 287 (1983).
11. The National Academy of Sciences has also undertaken a full reassessment of the possible climatic effects of nuclear war under the sponsorship of the Defense Nuclear Agency. The present analysis was stimulated, in part, by a preliminary request by the NAS to study the climatic effects of nuclear dust.
12. OTA, The Effects of Nuclear Mar, Office of Technology Assessment, OTA-NS-89, 151 pp. (1979).
13. Coggle, 0. E., and P. J. Lindop, Ambio, 11, 106 (1982).
14. Bergstrom, S., et al.. “Effects of Nuclear War on Health and Health Services,” World Health Org. Publ. A36.12 (1983).
15. Turco, R. P., 0. B. Toon, T. P. Ackerman, J. B. Pollack and C. Sagan, “Long-term atmospheric and climatic consequences of nuclear war,” to be submitted to J. Geophys. Res. (1983).
16. Turco, R. P., P. Hamill, 0. B. Toon, R. C. Whitten and C. S. Kiang, J. Atmos. Sci., 36, 699 (1979); Turco, R. P., P. Hamill, 0. B. Toon, R. C. Whitten and C. S. Kiang, NASA Tech. Paper 1362, 94 pp. (1979); Turco, R. P., 0. B. Toon, P. Hamill and R. C. Whitten, J. Geophys. Res., 86, 1113 (1981); Turco, R. P., 0. B. Toon and R. C. Whitten, Rev. Geophys. Space Phys., 20, 233 (1982); Turco, R. P., 0. B. Toon, R. C. Whitten, P. Hamill and R. G. Keesee, J. Geophys. Res., 88, 5299 (1983).
17. Toon, 0. B., R. P. Turco, P. Hamill, C. S. Kiang and R. C. Whitten, J. Atmos. Sci., 36,,718 (1979); Toon, 0. B., R. P. Turco, P. Hamill, C. S, Kiang and R. C. Whitten, NASA Tech. Paper 1363, 67 pp. (1979).
18. Pollack, J. B., 0. B. Toon, C. Sagan, A. Summers, B. Baldwin and W. VanCamp, J. Geophys. Res., 81, 1071 (1976); Toon, 0. B., and T. P. Ackerman, Appl. Optics. 20, 3657 (1981); Ackerman, T. P., and 0. B. Toon, Appl. Optics. 20, 3661 (1981).
19. Advisors, Ambio, 11, 94 (1982).
20. Jane’s Weapon Systems, 1981-1982, R. T. Pretty, Ed., Jane’s Publ. Co., London (1981).
21. The Military Balance 1982-1983, The International Institute for Strategic Studies, 23 Tavistock Street, London (1983).
22. World Armaments and Disarmament, Stockholm International Peace Reserch Institute Yearbook 1982, Taylor and Francis Ltd., London (1982).
23. Forsberg, R., Sci. Amer., 247, 52 (1982).
24. The unprecedented difficulties involved in controlling and limiting a nuclear exchange are discussed by P. Bracken and M. Shubik (Technology in Society, f_, 155, 1982), and by D. Ball (Adelphi Paper 169, International Institute for Strategic Studies, London, 1981).
25. Kemp, G., Adelphi Paper 106, International Institute for Strategic Studies, London (1974).
26. Glasstone, S., and P. J. Dolan (Eds.), The Effects of Nuclear Weapons, U.S. Department of Defense, 653 pp. (1977).
27. The areas quoted are subjected to peak overpressures ~ 2-3 psi and thermal irradiances > 10-20 cal/cm2.
28. A 1 MT surface explosion will eject ~ 5 x 10⁶ tons of debris, forming a large crater (Ref. 26). Typical soils consist of » 5-25% by weight of grains < 1 pm radius (D1Almeida, G. A., and L. Schu’tz, J. Climate Appl. Meteorol., 22, 233, 1983; G. Rawson, private communication, 1983). The extent of disaggregation into parent grain sizes is probably < 10%, however (Pinnick, R. G., G. Fernandez and B. D. Hinds, Appl. Optics, 22, 95 1983), and would depend in part on soil moisture and compaction.29. A 1 MT surface explosion can vaporize 5 2-4 x 10⁴ tons of soil material (Ref. 26), which is ingested by the fireball. Some of the silicates and other refractory materials later renucleate into fine glassy spheres (Nathans, M. W., R. Thews, and I.J. Russell, in Radionuclides in the Environment, Adv. Chem. Ser., 93, 360, 1970).
30. A 1 MT surface explosion can raise significant quantities of dust over an area of > 100 km2 by popcorning, due to thermal radiation, and by saltation, due to pressure winds and turbulence (Ref. 26). Much of the dust is sucked up in the afterwinds established by the rising fireball. Size sorting should favor the greatest lifting for the finest particles. The quantity of dust lofted would be sensitive to soil type, moisture and compactness, vegetative cover, and terrain. Probably > 1 x 10^ tons of dust can be incorporated into the stabilized clouds in this manner.
31. Gutmacher, R. G., G. H. Higgins and H. A. Tewes, Lawrence Livermore Laboratory Report UCRL-14397 (1983); J. Carpenter, private communication (1983).
32. Nathans, M. W., R. Thews and I. J. Russell, in Radionuclides in the Environment, Adv. Chem. Series, 93, 360 (1970). These data suggest size distributions that are log-normal at small sizes (< 3µm) and power law (r -α) at larger sizes. Considering data from a number of nuclear tests, we have adopted an average log-normal mode radius of 0.25µm, a α 2.0, and an exponent, a α 4 (Ref. 15). If all particles in the stabilized clouds lie in the range 0.01 to 1000 m radius, the adopted size distribution has = 8% of the total mass in particles < 1µm radius; this fraction of the stabilized cloud mass represents < 0.5% of the total ejecta and sweep-up mass of a surface explosion, and amounts to = 25 tons/KT of yield.
33. Ishikawa, E., and D. L. Swain (Trans!.), Hiroshima and Nagasaki: The Physical, Medical and Social Effects of the Atomic Bombings, Basic Books, New York, 706 pp. (1981).
34. At Hiroshima, a 5 13 KT device created a fire over 5 13 km2. At Nagasaki, where irregular terrain inhibited mass fire formation, a = 22 KT weapon caused a fire over = 7 km2. These two cases suggest that low yield (< 1 MT) nuclear explosions can readily ignite fires over an area of 5 0.3-1.0 km2/KT. This is roughly the area contained within the « 10 cal/cm2 and the 2 psi-overpressure contours (Ref. 26).
35. Broido, A., Bull. Atomic Sci.. 16, 409 (1960).
36. Miller, C. F., “Preliminary evaluation of fire hazards from nuclear detonations,” Stanford Research Institute Memorandum Report, Project IMU-4021-302, 63 pp. (1962).
37. Ayers, R. U-., Environmental Effects of Nuclear Weapons, Vol. I, Hudson Institute Report, HI-518-RR, New York (1965).
38. Martin, S. B., “The role of fire in nuclear warfare,” URS Research Co. Report URS-764 (DNA 2692F), 166 pp. (1974).
39. DCPA Attack Environment Manual, Chapter 3, U.S. Department of Defense, Washington, D.C. (1973).
40. FEMA Attack Environment Manual, Chapter 3, “What the Planner Needs to Know About Fire Ignition and Spread,” Federal Emergency Management Agency, CPG 2-1A3 (1982).
41. Brode, H. L.» Large-Scale Urban Fires, Pacific Sierra Research Corp. Note 348, Santa Monica, CA (1980).
42. Larson, D. A., and R. D. Small, Analysis of the Large Urban Fire Environment, Pacific Sierra Research Corp. Rpt. 1210, Santa Monica, CA (1982).
43. The urban and suburban areas of cities with populations exceeding 100,000 (about 2300 worldwide) are surveyed in (15). Also discussed are global fuel reserves, which are shown to be roughly consistent with known rates of production and accumulation of combustible materials.
44. Smoke emission data for forest fires are reviewed by D. V. Sandberg, J. M. Pierovich, D. G. Fox and E. W. Ross, Effects of Fire on Air, Forest Service Tech. Rpt. W0-9 (1979). The largest emission factors occur in intense large-scale fires where smouldering and flaming conditions exist simultaneously, and the oxygen supply may be limited over part of the burning zone. Smoke emissions from urban fuels consisting of synthetic organic compounds would be larger than those from forest fuels (e.g., C. P. Bankston, B. T. Zinn, R. F. Browner and E. A. Powell, Comb. Flame, 41_, 273, 1981).
45. Sooty smoke is a complex mixture of oils, tars and graphitic (or elemental) carbon. Measured benzene-soluble mass fractions of wildfire smokes fall in the range 3 40-75% (Sandberg et al., Ref. 44). Most of the residue is likely to be brown to black (the color of smoke ranges from white, when large amounts of water vapor are present, to yellow or brown, when oils predominate, to gray or black, when elemental carbon is a major component).
46. Tewarson, A., in Flame Retardant Polymeric Material, Vol. 3, M. Lewin, S. M. Atlas and E. M. Pierce, Eds., Plenum, NY, pp. 97-153 (1982). In small laboratory burns of a variety of polymeric compounds, the emissions of “solid” materials (which remained on collection filters after baking at 100°C for 24 hours) ranged from 5 1-15% by weight of the carbon consumed; of low volatility liquids, – 2 to 35%, and of high volatility liquids, * 1 to 40%. The optical extinction of the smokegenerated by a large number of samples varied from ~ 0.1-1.5 m2 per gram of fuel burned.
47. In wildfires, the particle number mode radius is typically ~ 0.05 um (Sandberg et al., see Ref. 44). For burning synthetics, the number mode radius can be substantially greater, but a reasonable average value is ~ 0.1 um (e.g., C. P. Bankston, B. T. Zinn, R. F. Browner and E. A. Powell, Comb. Flame, 41, 273, 1981). Often, larger debris particles and firebrands are swept up by powerful fire winds, but these have short atmospheric residence times and are not included in the present estimates (C. K. McMahon and P. W. Ryan, Paper 76-2.3, 69th Annual Meeting, Air Pollution Control Assoc., Portland, Oregon, June 27-July 1, 1976). Nevertheless, because winds exceeding 100 km/hr may be generated in large-scale fires, significant quantities of fine noncombustible surface dust and explosion debris (e.g., pulverized plaster) might be lifted in addition to the smoke particles.
48. This assumes an average graphitic carbon fraction of about 15-30% (J. T. Twitty and J. A. Weinman, J. Appl. Meteorol., 10, 725, 1971; S. Chippett and W. A. Gray, Comb. Flame, 31, 149, 1978). The real part of the refractive index of pure’carbon is 1.75, and of many oils, is 1.5. Smoke particles were assigned a density of 2 g/cm2; graphite has a density =2.5 g/cm2, and most oils, < 1 g/cm2.
49. A number of targets with military, economic or political significance can also be identified in tropical northern latitudes and in the Southern Hemisphere (e.g., Ref. 19).
50. The direct attentuation (neglecting subsequent scattering) of sunlight by dust and smoke particles obeys the law, I/I0 = exp (-τ), where T is the extinction optical depth due to photon scattering and absorption by the particles, and arccosµ0 in the solar zenith angle. The optical depth depends on the wavelength of the light and the size distribution and composition of the particles, and must generally be calculated using Mie theory (assuming equivalent spherical particles). The total light intensity (direct plus diffuse) depends on both the scattering and absorption optical depths (τs and τa, respectively). The maximum light intensity possible is Ix = I0 exp(-τa). The optical depth can be written as,τ= SML, where S is the specific cross-section (m2 per gram of particulate), M is the suspended particle mass concentration (g/m2), and L is the path length (m). Fine dust and smoke have a Ss of s 1-5 m2/g at visible wavelengths. However, Sa is very sensitive to the imaginary index of refrction. For typical soil particles, Sa < 0.1 m2/g. For smokes, Sa can vary from ~ 0.1 to 10 m2/g, roughly in proportion to the fraction of elemental carbon (graphite) in the particles. Occasionally, specific extinction coefficients for smoke are stated relative to the mass of fuel burned; then S implicitly includes a multiplicative emission factor (grams of smoke generated per gram of fuel burned).
51. Turco, R. P., 0. B. Toon, R. C. Whitten and P. Hamill, Trans. Am. Geophys. Union (EOS). 63, 901 (1982).
52. Ogren, J. A., in Particulate Carbon: Atmospheric Life Cycle, G. T. Wolff and R. L, Klimisch, Eds., Plenum Press, NY, pp. 379-391 (1982).
53. Landsberg, H. E., and J. M. Albert, Weatherwise, 27, 63 (1974).
54. Stommel, H., and E. Stommel, Sci. Amer., 240, 176 (1979).
55. Toon, 0. B., and J. B. Pollack, Natural History, 86, 8 (1977).
56. Lamb, H. H., Climate Present, Past and Future, Vol. 1, Fundamentals and Climate Now, 613 pp.; Vol. 2, Climatic History and the Future, 835 pp., Methuen, London (1977).
57. Notwithstanding possible alterations in the surface albedo due to the fires and deposition of soot (see Refs. 15, 74).
58. Milne, D. H., and C. P. McKay, Geological Soc. Amer. Special Paper 190, L. T. Silver and P. H. Schultz, eds., p. 297 (1982).
59. Toon, 0. B., Trans. Am. Geophys. Union (EOS), 63, 901 (1982).
60. The stratosphere is normally defined as the region of constant or increasing temperature with increasing height lying just above the troposphere. The residence time of fine particles in the stratosphere is considerably longer than in the upper troposphere due to the greater stability of the stratospheric air layers and the absence of precipitation in the stratosphere. With large smoke injections, however the ambient temperature profile would be substantially distorted and a “stratosphere” might form in the vicinity of the smoke cloud,” increasing its residence time at all altitudes (Ref. 15). Thus, the timescales for sunlight attenuation and temperature perturbations in Figures 1-7 may be considerably underestimated.
61. Transport of soot from the boundary layer into the overlying free troposphere can occur by diurnal expansion and contraction of the boundary layer, by large-scale advection, and by strong localized convection.
62. Barnaby, F., and J. Rotblatt, Ambio, 11, 84 (1982).
63. The term “intermediate” fallout distinguishes the radioactivity deposited between several days and % 1 month after an exchange from “prompt” fallout (< 1 day) and “late” fallout (months to years). The intermediate fallout is expected to be at least hemispherical in scale, and can still deliver a significant chronic whole-body gamma ray dose. The intermediate fallout may also contribute a substantial internal dose, for example from 131i. The intermediate gamma ray dose represents, in one sense, the minimum average post-exchange exposure. However, the geographical distribution of intermediate fallout would still be highly variable, and estimates of the average dose made with a one-dimensional model are greatly idealized. The present calculations were calibrated against the observed prompt fallout of nuclear test explosions (Ref. 15).
64. There is also reason to believe that the fission yield fraction of nuclear devices may be increasing as warhead yields decrease and uranium processing technology improves. If the fission fraction were unity, our dose estimates would have to be doubled. This also neglects additional potential sources of radioactive fallout from salted “dirty” weapons and explosions over nuclear reactors.
65. Lee, H., and W. E. Strope, Stanford Res. Inst. Report EGU 2981, Menlo Park, CA (1974). The authors studied exposure in the USA to transoceanic fallout generated by several assumed Si no-Soviet nuclear exchanges. Taking into account the weathering of fallout debris, protection by shelters, and a five-day delay before initial exposure, potential whole-body gamma ray doses 10 rad and internal doses > 10-100 rad, mainly to the thyroid and intestines, were estimated.
66. These estimates assume normal rates and patterns of precipitation, which control the intermediate radioactive fallout. In severely perturbed cases, however, it may happen that the initial dispersal of the airborne radioactivity is accelerated by heating, but that intermediate deposition is suppressed by lack of precipitation over land.
67. Johnston, J., G. Whitten and J. Birks, J. Geophys. Res., 78, 6107 (1973); Johnston, H. S., J. Geophys. Res., 82, 3119 (1977).
68. Gerstl, S. A. W., A. Zardecki and H. L. Wiser, Nature, 294, 352 (1981).
69. Esposito, M. P., T. 0. Tiernan and F. E. Dryden, Environmental Protection Agency Report EPA-600/280-197 (1980).
70. Josephson, J., Env. Sci. Techno!., _L7_, 124A (1983). In the burning of PCB’s, for example, the release of toxic polycyclic chlorinated organic compounds can amount to 0.1% by weight. In
the U.S. alone, more than 300,000 tons of PCB’s are currently in use in electrical systems (S. Miller, Env. Sci. Techno!., 17, 11A, 1983).
71. Chen, C.-S., and H. D, Orville (J. Appl. Meteorol., 16, 401, 1977) model the effects of fine graphitic dust on cumulus-scale convection. Among other findings, they show that strong convective motions can be established in still air within ten minutes after the injection of a km-sized cloud of submicron particles of carbon black, at mixing ratios < 50 parts per billion by mass. When excess humidity is added in their model to induce rainfall, stronger convection results; the carbon dust is raised higher and spread farther horizontally, while < 20% is scavenged by the precipitation. Gray, W. M., W. M. Frank, M. L. Torrin and T. A. Stokes (J. Appl. Meteorol., 15, 355, 1976) discuss possible weather modifications on the mesoscale (> 100 K) due to large carbon dust injections.
72. C. Covey, S. Thompson and S-. Schneider (prvt. comm.) of NCAR have carried out preliminary GCM simulations using soot burdens similar to those in our baseline model. They find major global circulation perturbations within a week of injection.
73. Eagan, R. C, P. V. Hobbs and L. F. Radke, J. Appl. Meteorol., U, 553 (1974).
74. Sagan, C, 0. B. Toon, and J. B. Pollack (Science, 206, 1363, 1979) discuss the impact of anthropogenic albedo changes in global climate. Nuclear war may cause albedo changes in several ways: by burning large areas of forest and grassland; by generating massive quantities of soot which can settle out on plants, snow fields and ocean surface waters; and by altering the pattern and extent of ambient water clouds. The nuclear fires in the present model consume an area ~ 1.5 x 10⁶ km2, or only = 1% of the global landmass; it is doubtful that an albedo variation over such a limited area is significant. All of the soot in the baseline nuclear war model, if spread uniformly over the Earth, would amount to a layer ~ 0.5µm thick. Even if the soot settled out uniformly on all surfaces, the first rainfall would wash it into soils and watersheds. The question of the effect of soot on snow and ice fields is currently under debate (J. Birks, prvt. comm., 1983). In general, soot or sand accelerates the melting of snow and ice. Soot which settles into the oceans would be rapidly removed by nonselective filter-feeding plankton, if they survived the initial darkness. In the present calculations, chemical changes in stratospheric O3 and NO2 concentrations cause a very small temperature perturbation compared to that caused by nuclear dust and smoke; it seems unlikely that chemically-induced climatic disturbances would be a major factor in a nuclear war. Tropospheric ozone concentrations, if tripled (Ref. 7), would lead to a small greenhouse warming of the surface (W. C. Wang, Y. L. Yung, A. A. Lacis, T. Mo and J. E. Hansen, Science, 194, 685, 1976). This might result in a more rapid surface temperature recovery. However, the tropospheric O3 increase is transient (~ 3 months duration) and probably of secondary importance to the contemporaneous smoke and dust perturbations.
76. Haberle, R. M., C. B. Leovy and J. B. Pollack, Icarus, 50, 322 (1983).
77. During the Martian dust storm of 1971/71, the IRIS experiment on Mariner 9 observed that particulates heated the atmosphere, and produced a vertical temperature gradient that was substantially subadiabaic (Hanel, R. B., et al., Icarus, 17, 4-23, 1972; Pollack, J. B., et al., J. Geophys. Res., 84, 2929, 1979).
78. A. V. Alexandrov, prvt. comm. (1983); S. Schneider, prvt. comm. (1983).
79. Thomas, G. E., B. M. Jakosky, R. A. West and R. W. Sanders, submitted to Geophys. Res. Lett., 1983; B. M. Jakosky, prvt. comm., 1983.
80. We gratefully acknowledge helpful discussions with Drs. J. Berry, H. Bethe, C. Dillings, H. Brode, R. Cicerone, L. Colin, P. Crutzen, R. Decker, P. Dolan, P. Dyal, F. Dyson, P. Ehrlich, B. Feld, R. L. Garwin, F. Gilmore, L. Grinspoon, A. Kuhl, P. Morrison, E. Patterson, R. Perret, G. Rawson, J. Rotblatt, E. E. E. Salpeter, S. H. Schneider, S. Soter and R. Whitten on a variety of subjects related to this work. We particularly thank Janet Moore Toll as for compiling information on world urbanization and May Liu for her assistance with computer programming.


